


Demographics
This section reflects insights from 600 Executive Assistants who are part of the global CCing My EA and Vimcal EA communities. While not a full industry census, these results offer a detailed look into the future of the profession.
Roles & titles
Executive Assistant:
65.2%
Senior Executive Assistant:
22.2%
Chief of Staff:
2.5%
Administrative/Office Manager:
3.3%
Other:
6.8%
Years of experience

Less than 1 year
5.2%

1-3 years
16.5%

4-6 years
17.8%

7-10 years
16.3%

10+ years
44.2%
This sample skews experienced; nearly half report 10+ years in EA or similar roles.
Primary industries (multiple choice; totals >100%)
Technology
22.2%
Finance
14.7%
Non-profit
13.2%
Corporate and Large Enterprise
12.9%
Education
12%
Startup
10%
Small Medium Businesses
9.3%
Healthcare
8.5%
Retail and Consumer Goods
4.2%
Media and Entertainment
3.7%
Other
19%
These were open text answers so they’re likely under-reported:
Government
2.6%
Law
2.3%
Manufacturing
1.7%
Construction
1.2%
Insurance
0.8%
Consulting
0.8%
Real Estate
0.8%
Hospitality
0.7%
Biotech
0.7%
Energy
0.5%
Engineering
0.5%
Marketing
0.5%
Breakdown by country
1)
United States
77%
Tier 1 (NYC + Bay Area):
21.3%
Tier 2 (Other high-cost metros):
43.8%
Tier 3 (Other U.S. cities/towns):
34.8%
2)
Canada
7.7%
3)
United Kingdom
6.7%
4)
Australia
4.3%
5)
New Zealand
1.2%
6)
Netherlands
0.3%
7)
Poland
0.3%
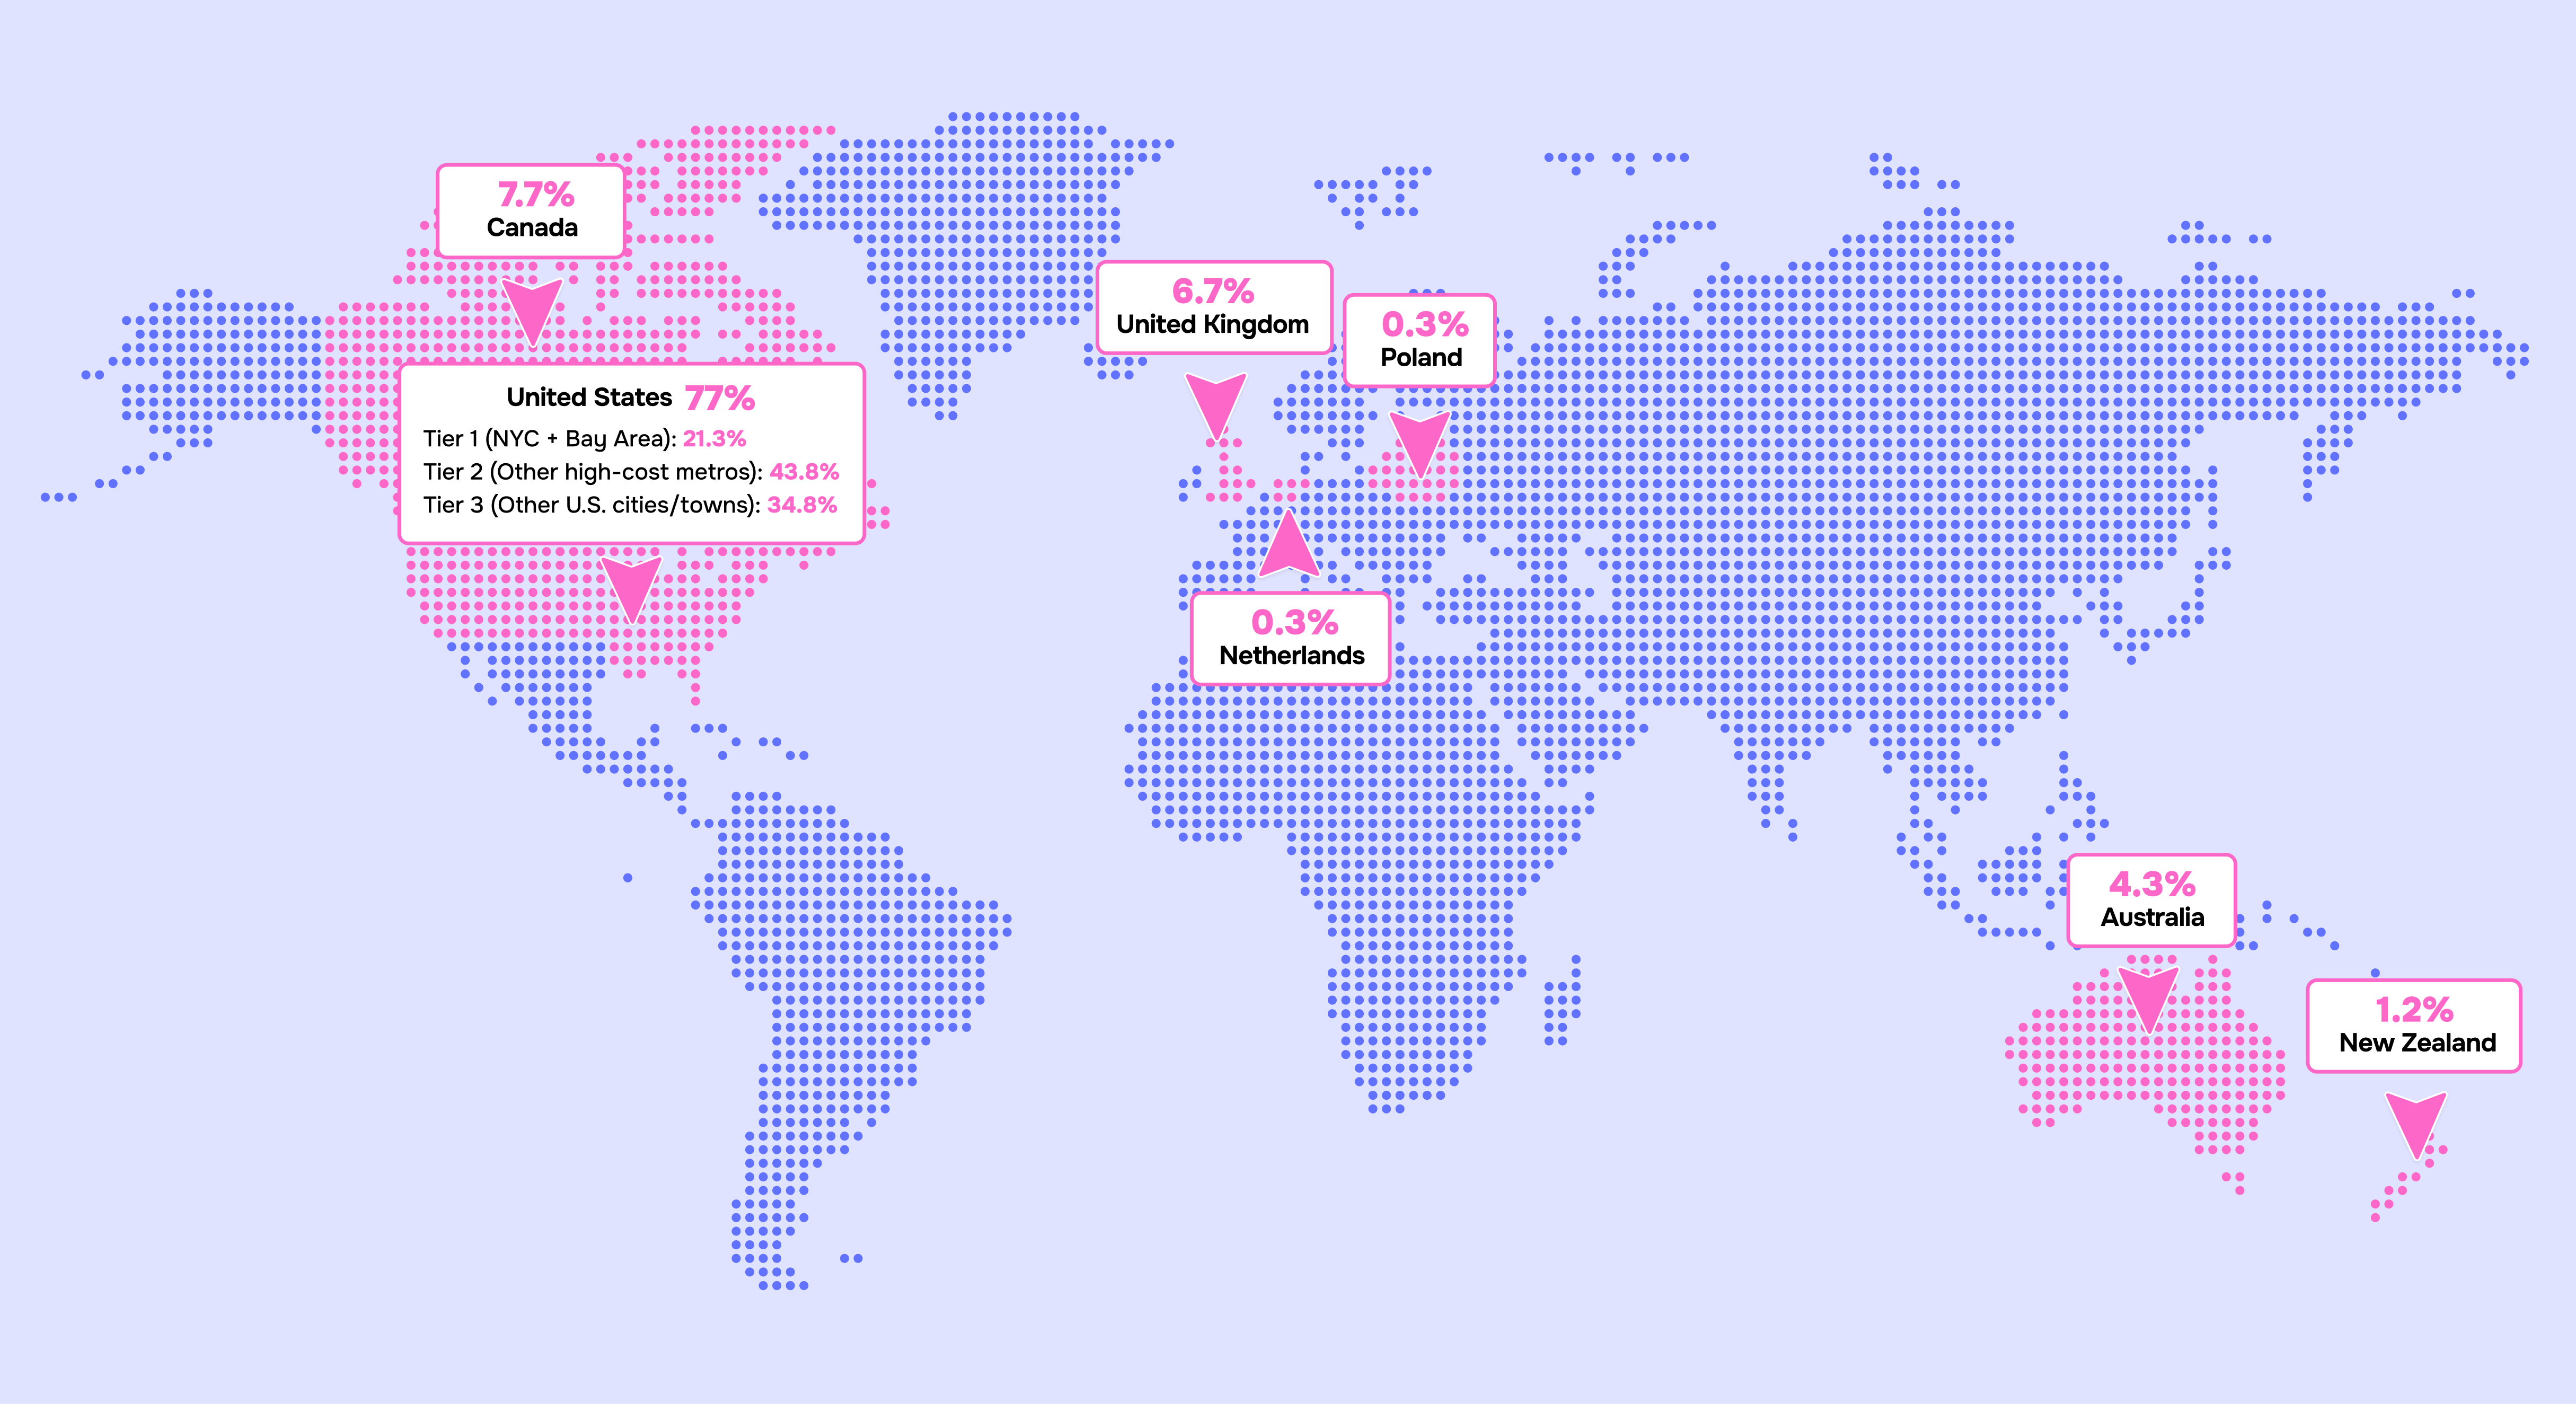
Most respondents are US-based, with meaningful representation in Canada, the UK, and Australia.
This map serves as a proxy on the maturity level of the EA profession in differing locations around the world.
This map serves as a proxy on the maturity level of the EA profession in differing locations around the world.